NBS: Property Prices in 70 Major Cities Up 7.7 Percent


The National Bureau of Statistics has released the data for property investment and sales for the first eleven months of this year on its official website.
Property Investment
Property investment rose by 36.5 percent from the same period last year to 4.27 trillion yuan. Property investment in November reached 0.46 trillion yuan, a 36.7 percent increase from November of last year, according to the NBS.
The total area under construction in China reached 3.84 billion meters square, a year on year increase of 28.6 percent. The area of completed construction in the first 11 months of 2010 totaled 0.49 billion square meters, reflecting a growth of 9.6 percent.
China's property developers purchased 0.36 billion square meters of property from January through November, a 33.2 percent increase from the same period last year.
Property Sales
The property sales volume of the first eleven months reached 0.83 billion square meters, climbing 9.8 percent since last year, and showing a 0.7 percent increase from the property sales volume of the first ten months.
The property sales volume was 0.1 billion square meters in November; it rose 14.5 percent year on year, and showed an increase of 9 percent from October.
Origin of Property Capital
China's property developers received 6.32 trillion yuan in capital, showing a 31.2 percent increase over the first eleven months.
Property Price Index
Property prices in 70 major Chinese cities rose 7.7 percent year on year in November. The growth rate of property prices fell 0.9 percent in November from that of the previous month, but was 0.3 percent higher than the growth rate in November 2009.
Prices of new homes climbed 9.3 percent year on year in November and were 1.3 percent lower than October and 0.4 percent higher than last quarter.
Commodity housing prices increased 10.4 percent. Sales prices of midrange properties showed an increase of 9.4 percent and sales of high-end properties showed a growth of 14.1 percent. The price of affordable housing units had a year on year growth of 1 percent.
Prices of old homes in November saw a year on year growth of 5.6 percent and a 0.3 percent drop from October.
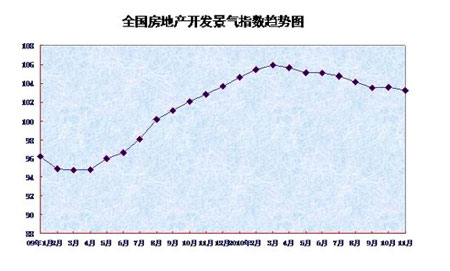
National Property Development Index
The national property development index (known as the national housing boom index) is 103.2, 0.37 points lower than that of October and 0.42 points higher than that of a year earlier.
Graph of national housing boom index:
This article was edited by Rose Scobie and Ruoji Tang
Links and Sources
National Bureau of Statistics
The views posted here belong to the commentor, and are not representative of the Economic Observer |
Related Stories
Popular

- INTERVIEW
- Interview with Artur Runge-Metzger
- The EO conducted an interview with Artur Runge-Metzger about the progress of the conferenc...

Interactive


Multimedia


E-paper
|


- EEO.COM.CN The Economic Observer Online
- Bldg 7A, Xinghua Dongli, Dongcheng District
- Beijing 100013
- Phone: +86 (10) 6420 9024
- Copyright The Economic Observer Online 2001-2011